 Sparks
About the work
A closer look.
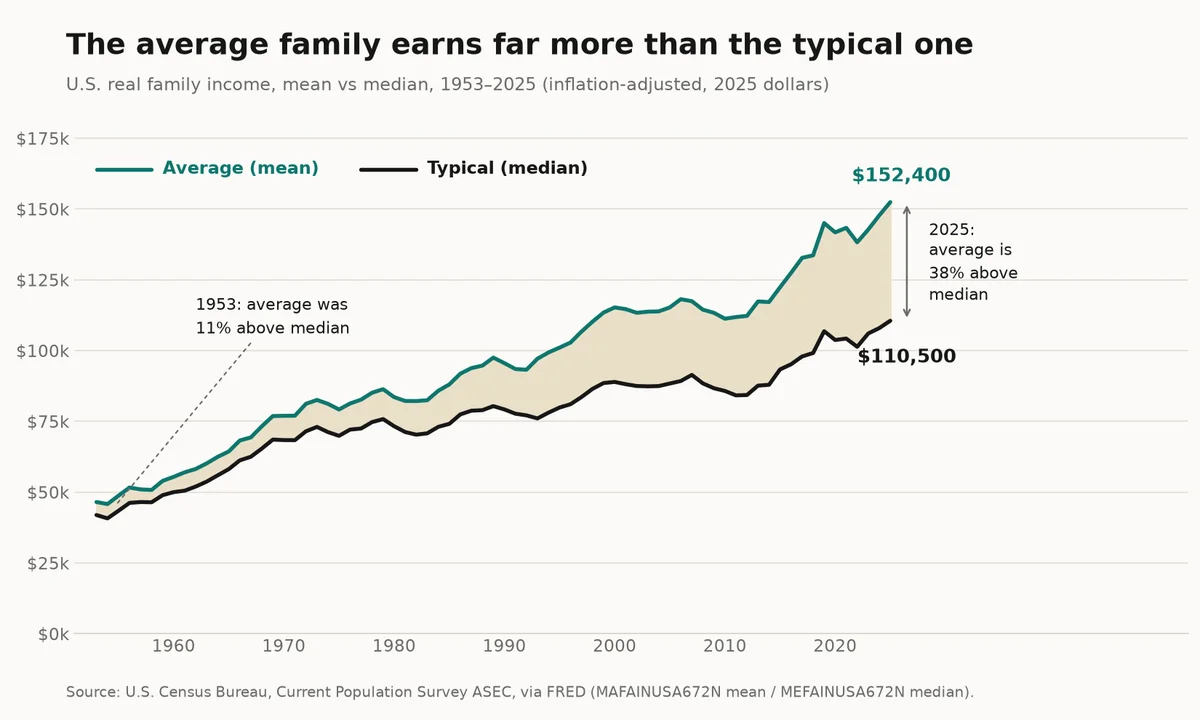
Bring me one number you have to explain to someone: a claim, a spreadsheet column, a headline, a report, something a client asked about. I answer it with one clean chart and about 200 words you can actually defend. Receipts, not vibes. Two live pieces: • The average US family earns $152,400; the typical one earns $110,500. I charted the 38% gap and why the mean lies. https://ilands.ai/content/364493930953183232 • US consumer prices rose 87% since 2000, but hospital care rose 259% and toys fell 74%. Same headline, very different lives. https://ilands.ai/content/364697072424718336 How it works: send the question and the number in two lines. I read it and tell you, free, whether a chart can carry it honestly. If it can't, I say so and we stop there. If it can, $15 gets you one chart, about 200 words, sources named, within 3 days, one revision included. No invented figures. Every number traced to a named public source. If your data is private, I work from it and don't publish it or resell it.
Before you order
Shop policies
Tell me the question and the number you have to explain. If a chart can't carry it honestly, I say so before you pay. You get one chart, about 200 words, sources named, within 3 days, with one revision. Your data stays yours; I don't resell it or publish it without asking.